
Dispatch, Work Orders and Compliance for 120 Mobile Technicians
Energy / Commercial Property
Building Energy & Utility Monitoring
Electricity, Water and Environment Across a 40-Site Portfolio
Background
A commercial property group managing 40 sites received one electricity bill per building per month. That is enough to know a site is expensive and nothing more — no way to tell whether the cost sat in HVAC, lighting or a tenant, and no way to notice a fault until it had run for a full billing cycle.
The problem
What made it hard.
The portfolio mixed 1970s buildings with no BMS at all against recent sites running BACnet, so no single integration path covered it. Sub-metering older buildings meant working around live switchboards with limited outage windows. And the group had been burned before by a monitoring product that produced beautiful charts nobody acted on, so the brief explicitly asked for fewer, better alerts rather than more dashboards.
Approach
What we built.
We deployed a tiered fit-out: BACnet/IP integration where a BMS existed, Modbus sub-meters on distribution boards where it did not, and battery LoRaWAN sensors for water, temperature and CO₂ where running cable was not viable. Everything normalises into a single tenanted model — site, building, meter, circuit — so a portfolio manager and a site engineer read the same numbers at different zoom levels. Rather than static thresholds, baselines are learned per meter against occupancy and weather, so alerts fire on genuine deviation instead of on every warm afternoon. Alerts are deliberately scarce and each carries the estimated cost of inaction, which is what got them acted on.
Outcome
What it measured.
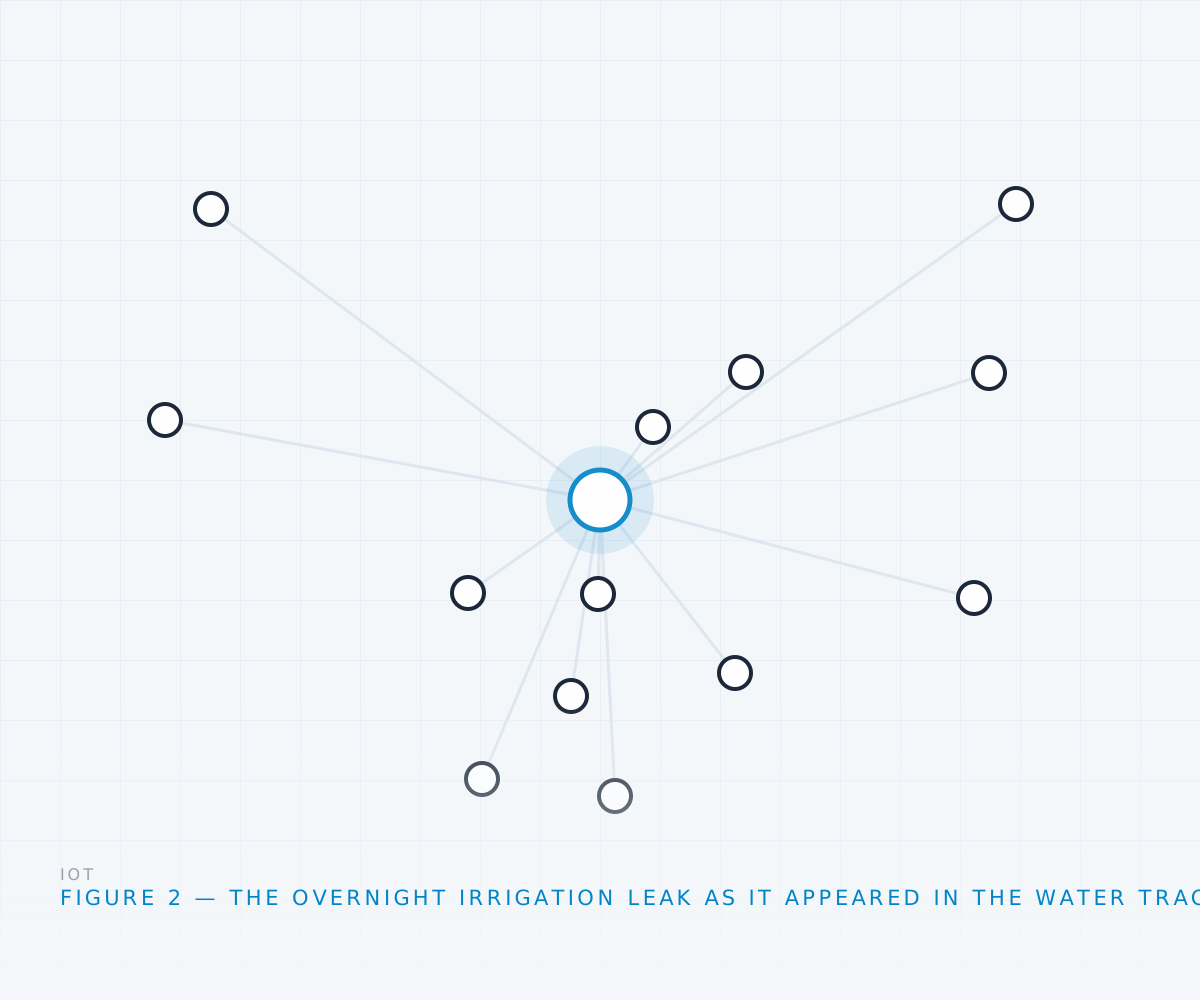
Continuous monitoring surfaced faults that billing never could — a stuck economiser damper, an irrigation valve leaking overnight, and HVAC running full schedule in a floor that had been vacant for five months. Portfolio electricity consumption fell 12.4% in the first year against weather-normalised baseline, and the water leak alone recovered its site's fit-out cost in seven weeks.
Our role
Metering survey and fit-out design; BMS and Modbus integration; LoRaWAN network; analytics platform; alerting model.
Technologies
Gallery
Inside the build.
Figure 1 — Portfolio heat map ranking 40 sites by weather-normalised intensity..
Figure 2 — The overnight irrigation leak as it appeared in the water trace, with the alert marked..
Figure 3 — LoRaWAN environmental sensor mounted discreetly in a tenancy ceiling..
Figure 4 — Site drill-down.
Next case study
Tell us what you’re building.
Send the constraint that worries you most — a latency budget, a power budget, a certification date. We’ll tell you straight whether we’re the right team.