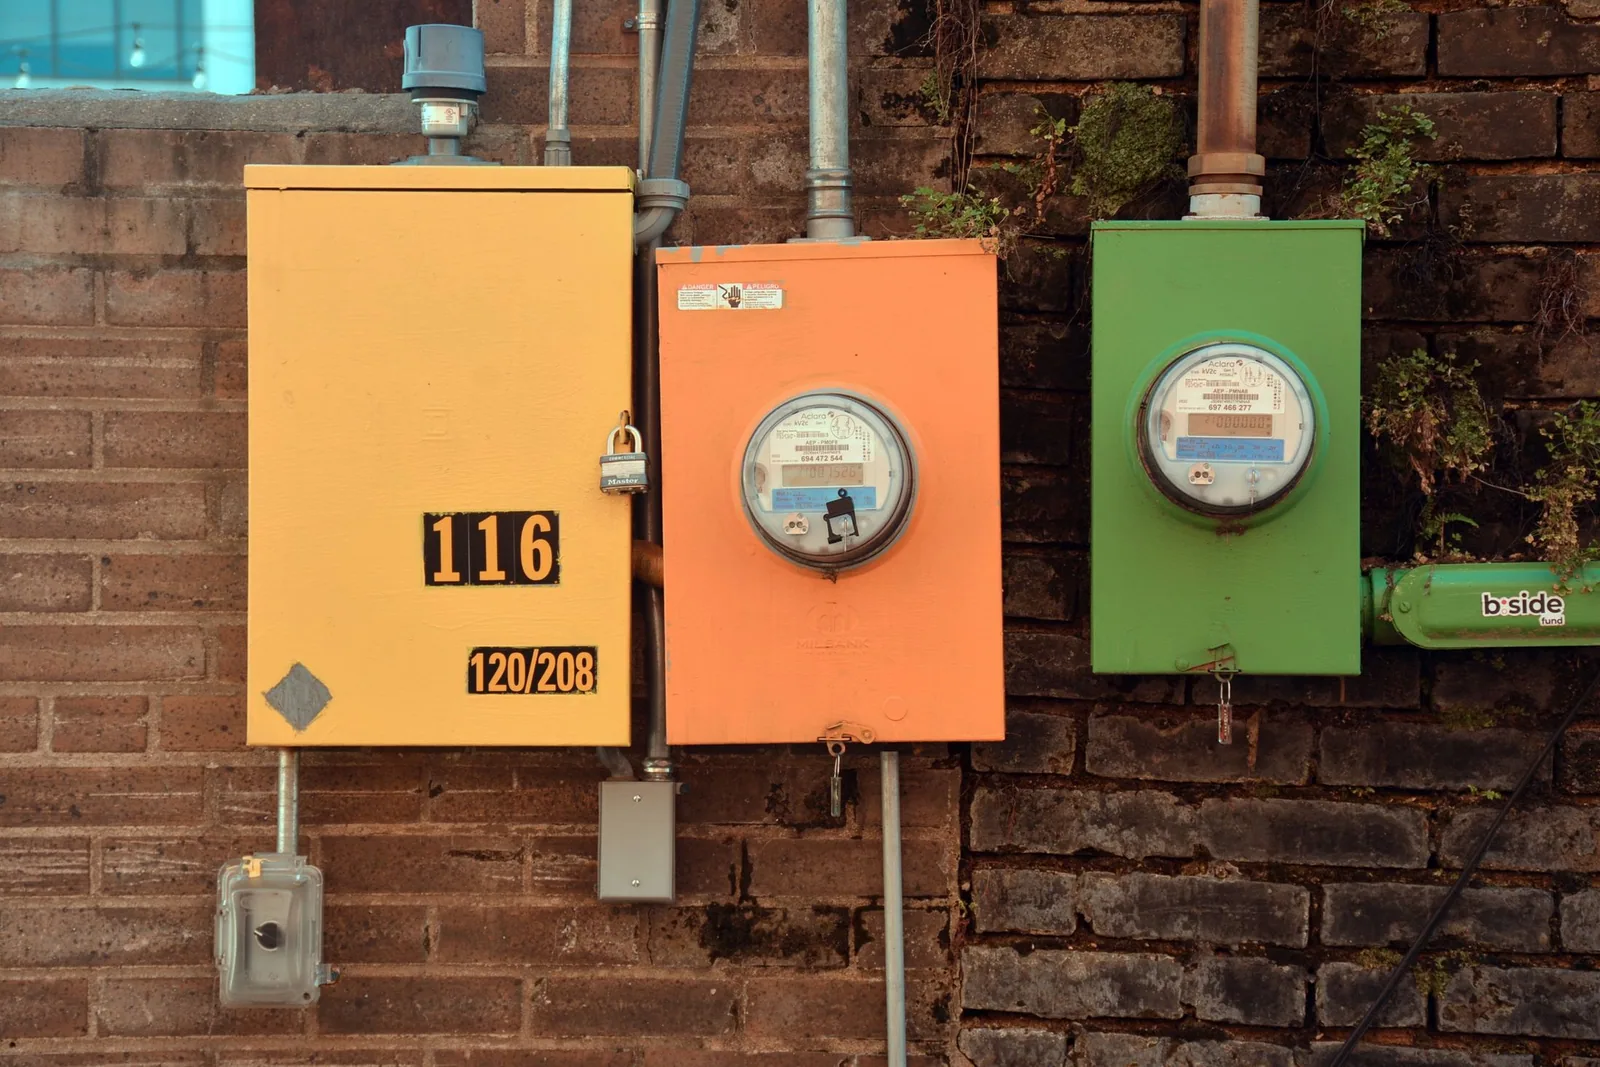
Electricity, Water and Environment Across a 40-Site Portfolio
Building Energy & Utility Monitoring
12.4%
weather-normalised electricity reduction, year one
40
sites unified across BMS, Modbus and LoRaWAN

Smart Manufacturing / MES
Shift Performance, Machine Utilisation and Quality in One Pane
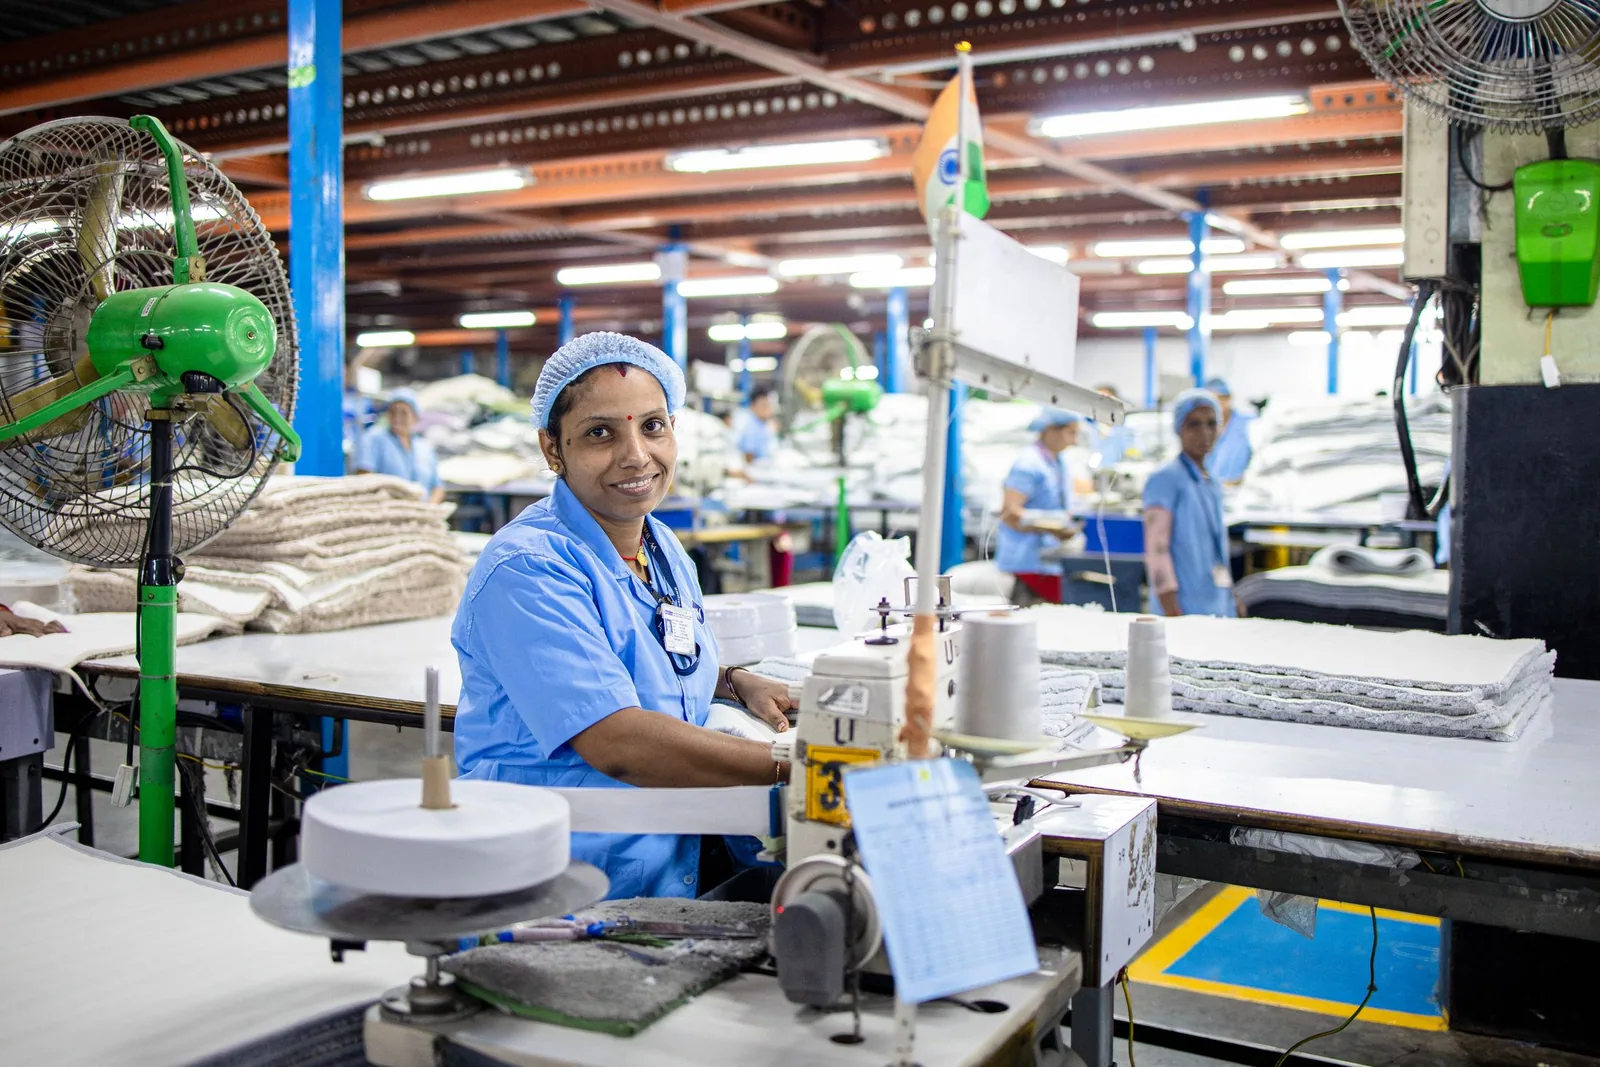
Background
A plastics manufacturer running 34 injection moulding machines across two shifts planned production in spreadsheets and reconciled output the following morning from paper shift sheets. Supervisors could tell you what had happened yesterday but not what was happening now, so recovering a slipping order meant discovering the slip a day late.
The problem
The machine fleet spanned four vendors and two decades - some exposed OPC UA, others offered only dry contacts for cycle and alarm. Operators had rejected a previous MES rollout because data entry competed with running the machine. And plant-floor connectivity dropped often enough that a cloud-only application would have been unusable during exactly the shifts that mattered.
Approach
We normalised the fleet behind a single machine model: OPC UA where available, and a small retrofit counter module reading cycle and alarm contacts everywhere else, so every machine reports the same events regardless of age. A plant-local service holds the authoritative production record and syncs to cloud when the link is up, which keeps the floor running through outages. The operator terminal was deliberately reduced to four touch targets - job start, job end, scrap with reason code, downtime with reason code - because anything more elaborate is what killed the previous attempt. Planning, OEE, shift reporting and quality tracking build on that event stream rather than on separate data entry.
Outcome
The plant gained live order status against plan for the first time, and supervisors began intervening on slipping orders within the shift instead of the next morning. Measured OEE rose from 61% to 74% over eight months, driven mostly by downtime reasons finally being visible and attributable. Shift reporting that had taken a supervisor 45 minutes a day became automatic.
Our role
OT integration and retrofit modules; platform architecture; operator UX; OEE and quality modelling; rollout and training.
Technologies
Gallery
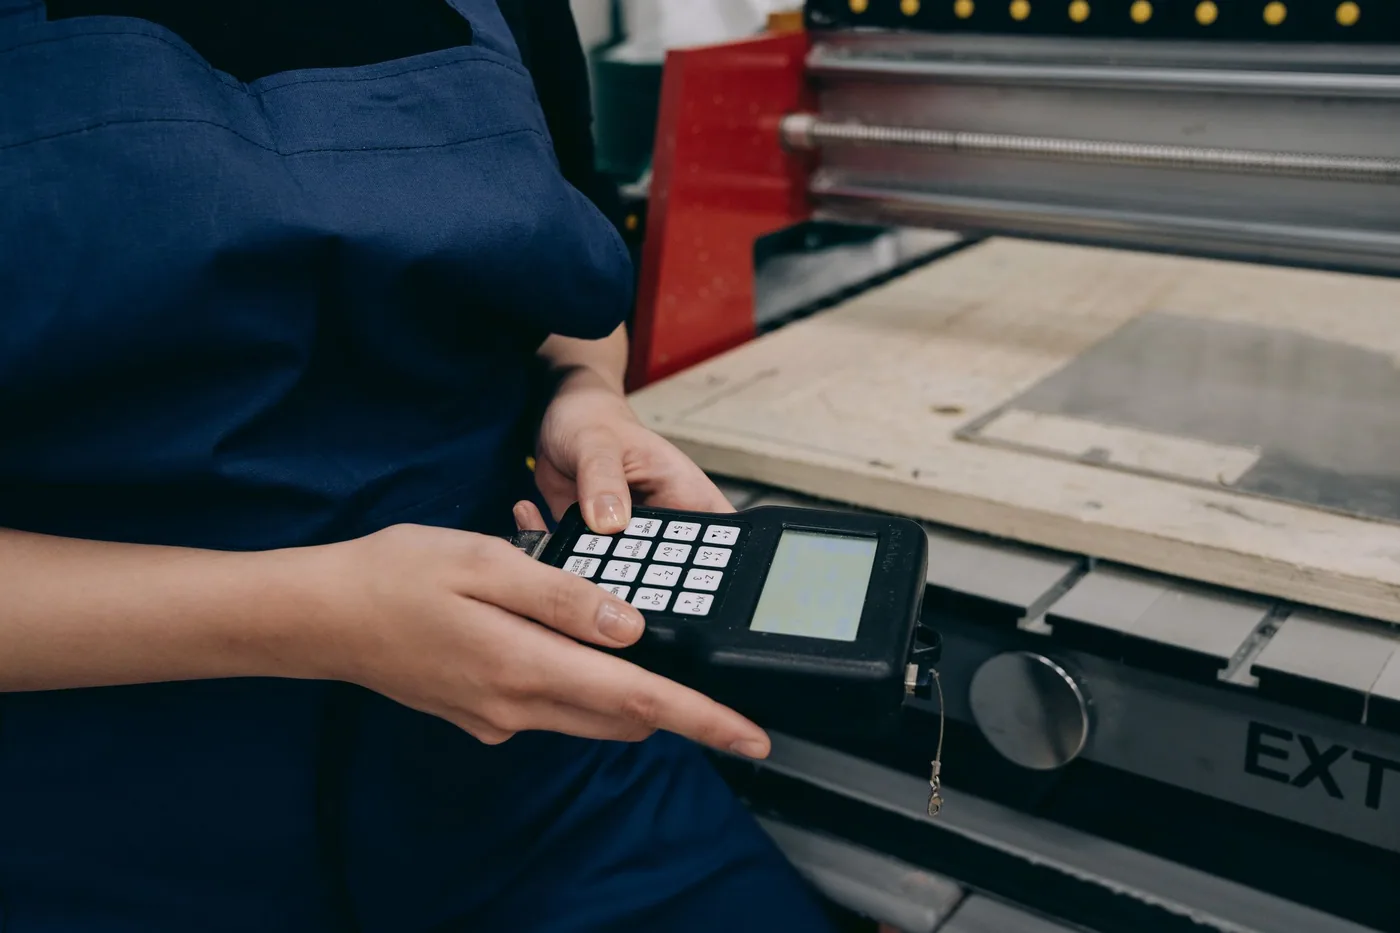
Illustrative of the shop-floor terminal layer: after an earlier MES rollout was rejected by operators, the screens were reduced to a few large targets usable with gloves mid-shift.
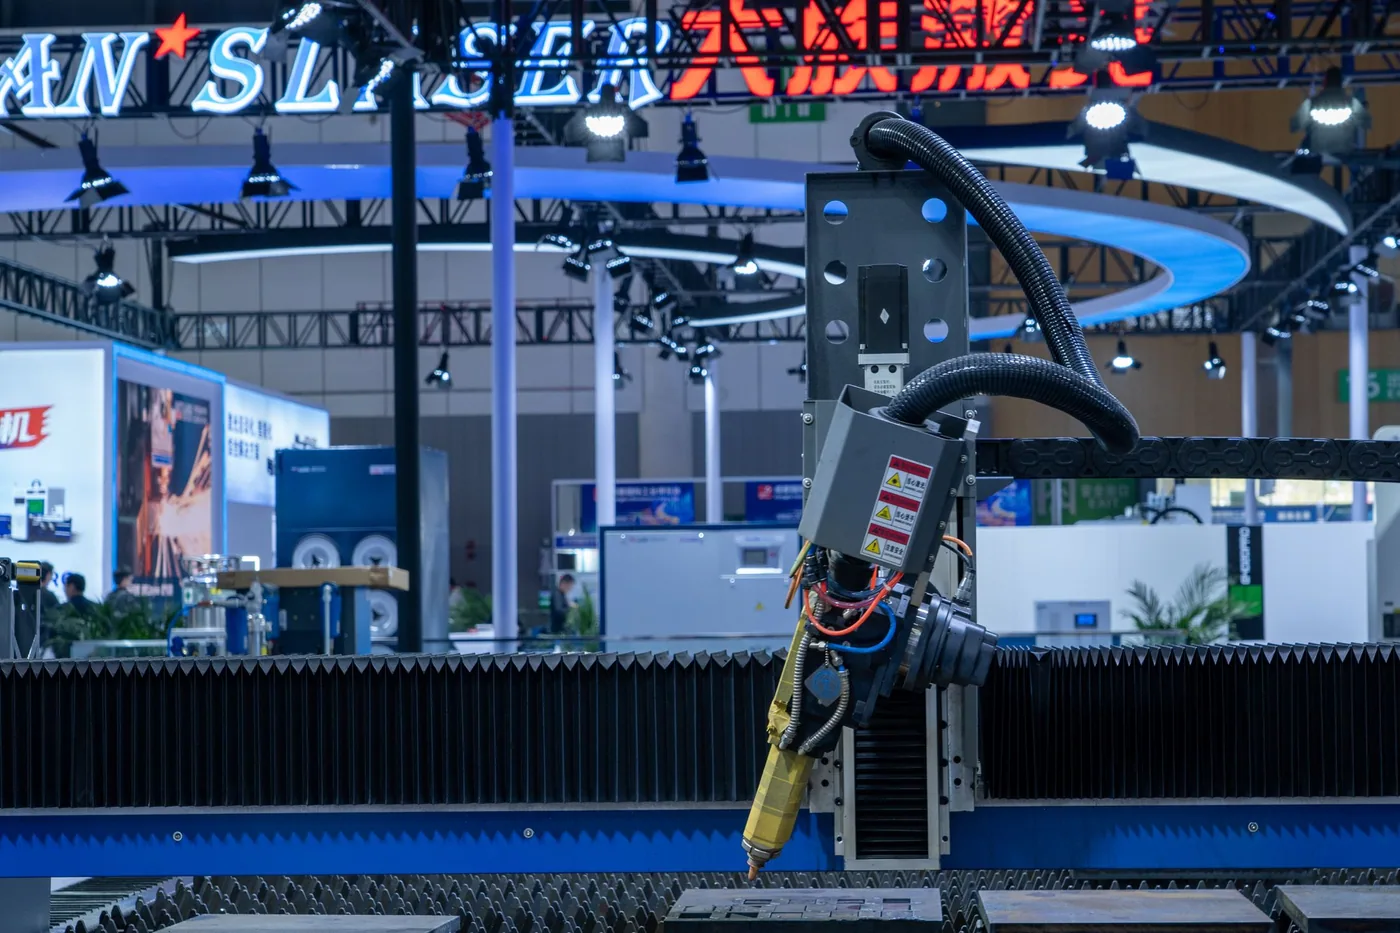
Illustrative of the newer half of the fleet: cycle state and alarms are read over OPC UA and aggregated into per-machine utilisation and OEE across 34 machines.

Illustrative of the integration problem on older assets: machines with no protocol interface expose only dry contacts, wired through an IO module before cycle and alarm events reach the time-series store.
Next case study
Electricity, Water and Environment Across a 40-Site Portfolio
Send the constraint that worries you most - a latency budget, a power budget, a certification date. We’ll tell you straight whether we’re the right team.